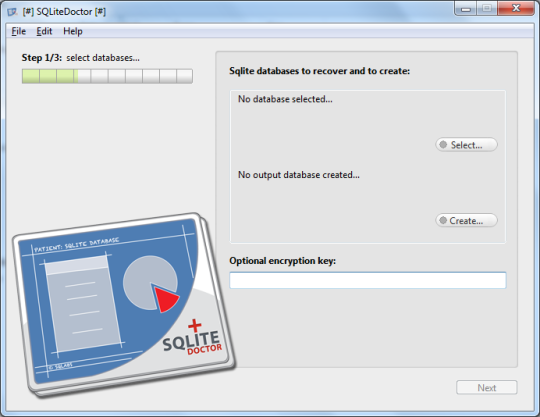
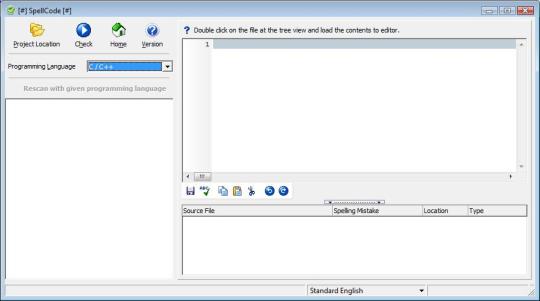
Software Screenshot:
Software Details:
Version: 3.1
Upload Date: 12 Jul 15
Developer: SciTech Software
Distribution Type: Commercial
Price: 145.00 $
Downloads: 86
Size: 15563 Kb
.NET Memory Profiler is a powerful tool for finding memory leaks and optimizing the memory usage in programs written in C#, VB.NET or any other .NET Language.
It allows you to retrieve information about all instance allocations performed on the garbage collected heap (GC heap) and all instances that reside on the GC heap. The retrieved information is presented in real-time, both numerically and graphically. Using the new unmanaged resources tracker, information about unmanaged resources such as HBITMAP, HWND and unmanaged memory is also presented.
What is new in this release:
- Visual Studio style presentation of instance fields
- Field name presentation in root paths and "Referenced by"
- Improved memory assertions
- Declarative memory assertions
- Visual Studio 2008 integration
- Easier navigation of types, resources, and instances
- WPF Browser Application profiling
- GC handle tracking
Requirements:
Comments not found